

Learn how the Forecast workspace works, how Expected Revenue and Expected Close Date affect forecasting, how risk classifications help identify slipping deals, how to use Week, Month, and Quarter views, and how to improve forecast quality with cleaner opportunity data.
Opportunity Forecasting is currently enabled through Labs. Labs features can continue to evolve, so available controls or labels may change over time. Forecast quality also depends on the completeness and accuracy of the opportunity data being analyzed.
2. Key Benefits of Opportunity Forecasting
3. Forecast Summary View
4. Forecast Timeline View
5. Expected Revenue and Probability Weighting
6. Expected Close Date
7. Risk Classification and Risk Settings
8. Forecast Data Hygiene
9. How To Set Up Opportunity Forecasting
10. Frequently Asked Questions
11. Need Help?
What is Opportunity Forecasting?
Opportunity Forecasting is a dedicated workspace inside Opportunities that helps teams estimate potential revenue using opportunity value, expected timing, probability, and deal-quality signals. The Forecast tab gives users a reporting-focused view of the pipeline without replacing the existing opportunity-management experience.
The Forecast workspace includes tools for:
- Reviewing overall forecast and revenue metrics
- Viewing opportunities across Week, Month, and Quarter periods
- Evaluating weighted Expected Revenue
- Using Expected Close Dates for time-based forecasting
- Identifying High, Medium, and Low risk opportunities
- Filtering forecasts by pipeline, owner, and other supported criteria
- Drilling into the opportunities behind forecast totals
- Identifying missing or stale opportunity data that can weaken forecast accuracy
Key Benefits of Opportunity Forecasting
Forecasting combines pipeline value, expected timing, probability, and risk signals so teams can review not only how much revenue is in the pipeline, but also how realistic and timely that revenue may be.
- Better Revenue Visibility: Review maximum potential revenue, expected revenue, and won revenue from a dedicated forecast workspace.
- More Realistic Forecasting: Use weighted opportunity values instead of treating every open opportunity as equally likely to close.
- Improved Timing Visibility: Use Expected Close Dates and time-based views to understand when revenue may land.
- Stronger Risk Awareness: Identify opportunities that may be slipping or overdue before they weaken the forecast further.
- Cleaner Pipeline Management: Surface missing values, missing dates, stale opportunities, and other data-quality issues.
- Faster Analysis: Apply filters, group data, and drill into forecast totals to investigate specific pipelines, owners, or time periods.
- Less Manual Forecasting: Reduce dependence on separate spreadsheets for recurring pipeline reviews.
Forecast Summary View
The Summary view provides a high-level snapshot of current forecast performance. It is useful for quick pipeline reviews when you want to understand the overall revenue outlook before investigating individual opportunities.
Review the available forecast metrics, then click into supported metrics to inspect the opportunities contributing to those totals. This helps move from a summary number to the specific deals that may require follow-up or data cleanup.
Forecast Timeline View
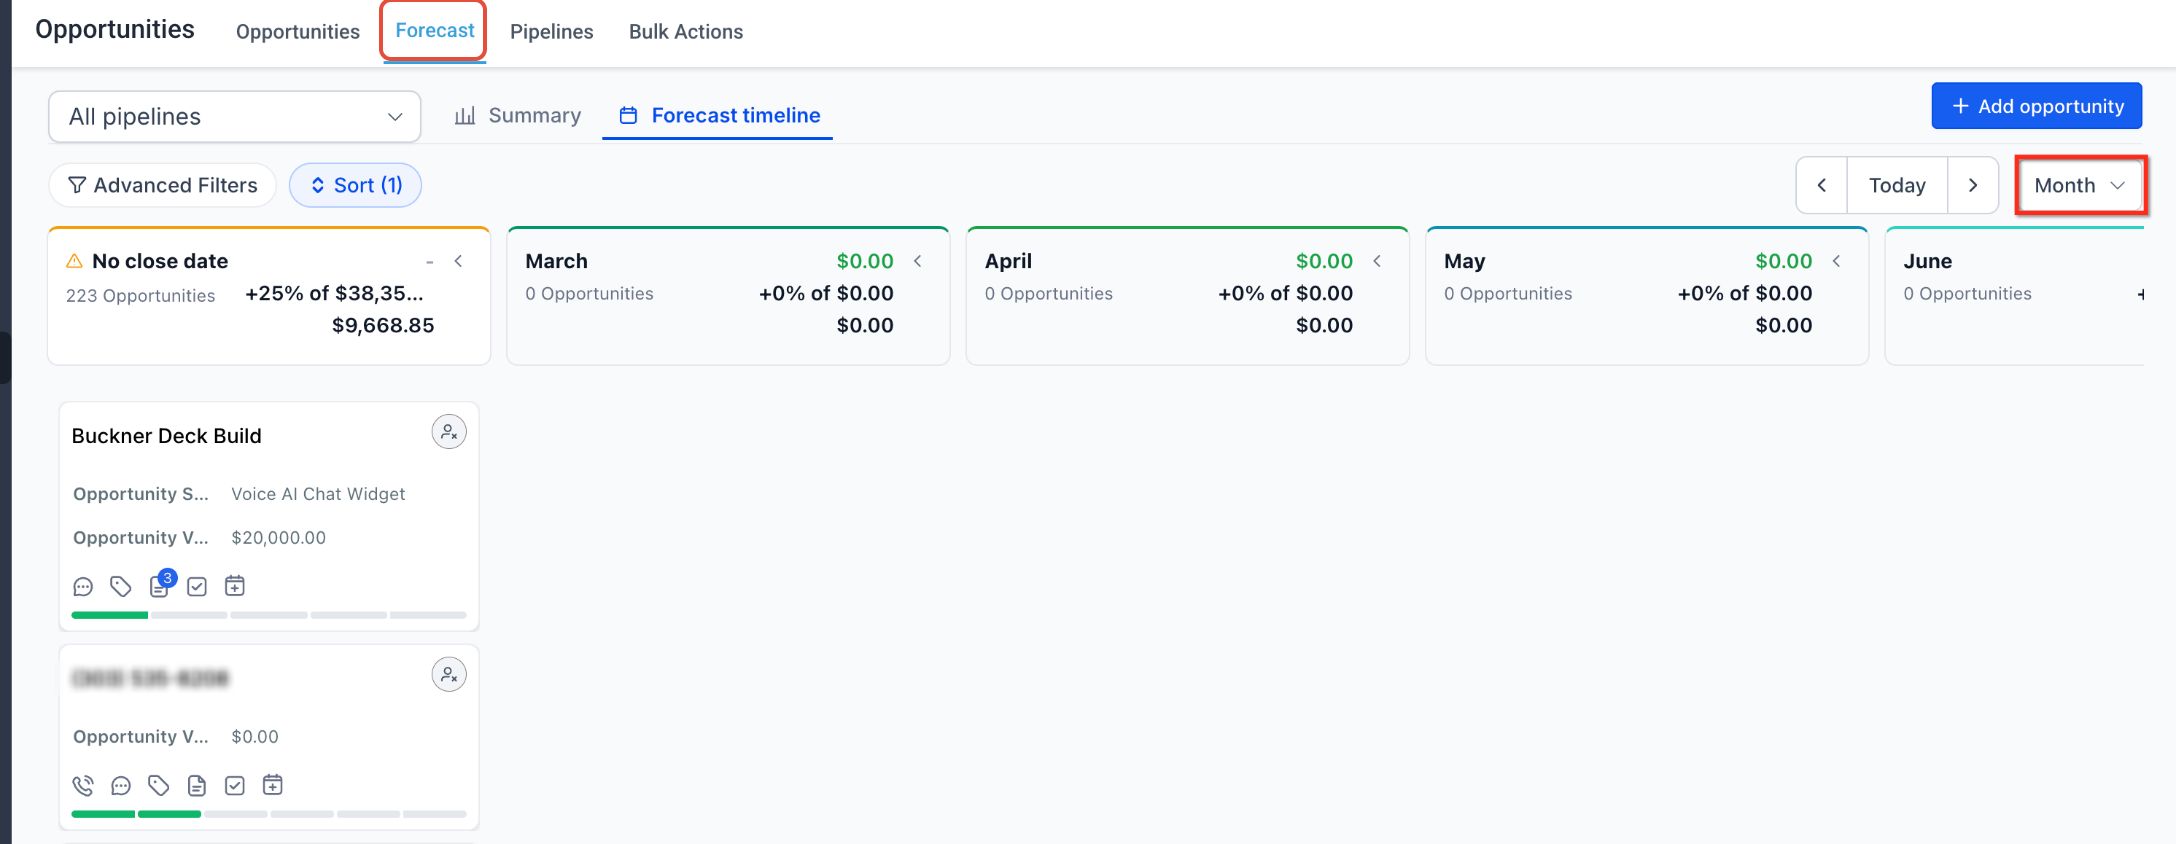
The Forecast Timeline organizes forecasted opportunities by expected timing so you can see when pipeline revenue is projected to close. This makes it easier to identify overloaded periods, future gaps, or opportunities that appear to be slipping into a later forecast window.
Switch between Week, Month, and Quarter to analyze revenue at the level that best fits your planning cycle.
Expected Revenue and Probability Weighting
Expected Revenue provides a probability-weighted view of potential revenue rather than treating the full value of every open opportunity as equally likely to close. This creates a more practical forecast when opportunities have different probabilities of success.
The Forecast workspace supports weighting based on opportunity probability, including stage probability and manual probability overrides where those are applied. Because forecast logic can evolve while the feature remains in Labs, use the values shown in the Forecast workspace rather than relying on an undocumented manual calculation.
Expected Close Date
Expected Close Date helps place each opportunity into the forecast period where the revenue is currently expected to close. This is especially important for Week, Month, and Quarter views because forecast timing depends on more than an opportunity’s pipeline stage.
Keep Expected Close Dates current as deal timing changes. An outdated or missing date can reduce the usefulness of time-based forecasting or cause an opportunity to appear in a period that no longer reflects the sales team’s expectations.
Risk Classification and Risk Settings
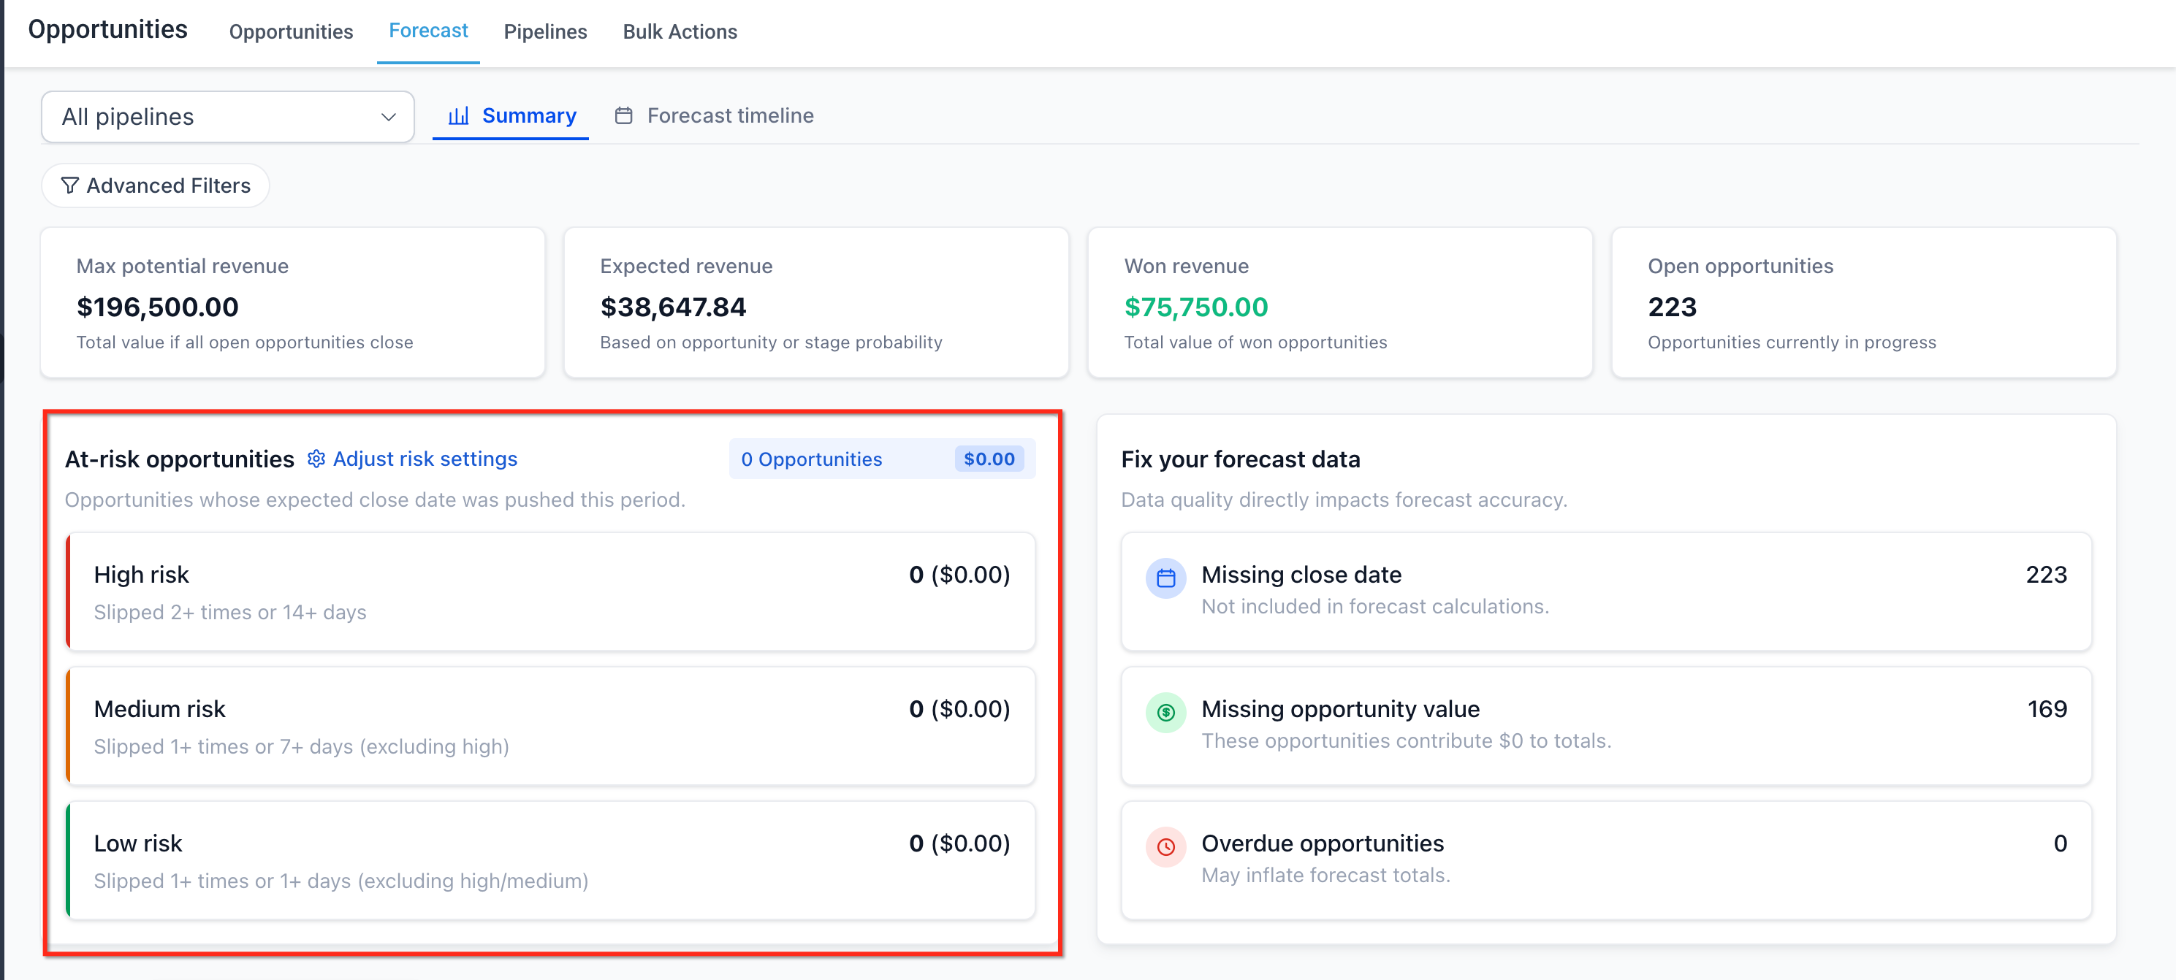
Risk classification helps highlight opportunities whose timing may be slipping or becoming overdue. This allows teams to focus attention on deals that could weaken the reliability of the current forecast if they are not reviewed.
| Risk Level | How to Use It |
|---|---|
| High | Prioritize these opportunities for immediate review when timing or slippage indicates a higher level of forecast risk. |
| Medium | Review these opportunities before they progress into a more serious timing or overdue condition. |
| Low | Monitor these opportunities while continuing normal follow-up and forecast maintenance. |
Risk settings allow you to adjust thresholds related to slippage and overdue opportunities so the classification better reflects your sales cycle.
Forecast Data Hygiene
A forecasting tool can only work with the opportunity data available to it. Data hygiene insights help surface records that may weaken forecast quality so sales teams can correct those records before relying on the resulting totals.
Review opportunities for issues such as:
- Missing opportunity values
- Missing Expected Close Dates
- Outdated Expected Close Dates
- Stale opportunities
- Incorrect pipeline or stage placement
- Probability values that no longer reflect the current state of the deal
How To Set Up Opportunity Forecasting
Useful forecasting requires both feature access and reliable opportunity data. Enable the feature first, then review the pipeline values, dates, probabilities, filters, and risk settings that influence the forecast before using it for planning.
Open Labs in the sub-account and enable Opportunity Forecasting.
Go to Opportunities and open the Forecast tab. Choose either the Summary view or the Forecast Timeline depending on the type of analysis you want to perform.
Select Week, Month, or Quarter based on how your team reviews pipeline timing.
Use the available filtering and grouping controls to focus the forecast on the pipeline, owner, date range, or other supported segment you want to analyze.
Click a supported metric or time bucket to review the opportunities behind that value. Compare those opportunities with the forecast total when investigating unexpected results.
Review the configured risk thresholds and adjust the slippage or overdue settings when necessary so the High, Medium, and Low classifications better match your sales cycle.
Use the available data-hygiene insights to identify opportunities with missing, stale, or outdated information. Update opportunity value, Expected Close Date, stage, probability, owner, and other relevant fields before relying on the forecast for planning.
Frequently Asked Questions
Need Help?
If the Forecast workspace is missing or the results look different from what you expect, review the feature setting and the underlying opportunity data before treating the issue as a reporting problem.
- Forecast tab is missing: Confirm Opportunity Forecasting is enabled in Labs for the correct sub-account.
- An opportunity is missing: Review its opportunity value, Expected Close Date, stage, probability, pipeline, owner, and active forecast filters.
- A deal appears in the wrong period: Check its Expected Close Date and confirm whether you are viewing Week, Month, or Quarter.
- Expected Revenue looks incorrect: Review the opportunity probability and any manual probability override before comparing the weighted forecast with total pipeline value.
- Risk classification looks incorrect: Review the deal’s timing and the configured slippage and overdue thresholds.
- Forecast totals are unexpectedly low: Look for missing opportunity amounts, dates, stale records, or restrictive filters.
- Forecast totals do not match another view: Compare the same pipeline, filters, status, owner, date range, and underlying opportunities before comparing totals.
- A recently changed opportunity is not where expected: Recheck the saved opportunity fields and active filters, then refresh the Forecast view.
- Issue continues: Collect the pipeline name, opportunity name, owner, amount, Expected Close Date, stage, probability, active filters, risk level, and screenshots of the Forecast view before contacting support.